Online therapy statistics at a glance
| Statistic | What was measured | Data period | Original source |
|---|---|---|---|
| 12.3%, about 32.6 million adults | U.S. adults who received mental-health treatment through telehealth during the past year | 2025 | SAMHSA, Figure 84 |
| 32.8% | Adults with any mental illness in the past year who received mental-health treatment through telehealth | 2025 | SAMHSA, Figure 85 |
| 46.0% | Adults with serious mental illness in the past year who received mental-health treatment through telehealth | 2025 | SAMHSA, Figure 85 |
| 14.0% | U.S. adults who received counseling or therapy from a mental-health professional, across delivery settings | 2024 | CDC/NCHS, Table 1 |
| 26.3% | Mental-health-provider visits delivered through telehealth for patients living in nonmetropolitan areas | Pooled 2021–2023 | AHRQ, Figure 1 |
| 48.9% | Mental-health-provider visits delivered through telehealth for patients living in metropolitan areas | Pooled 2021–2023 | AHRQ, Figure 1 |
Do not add these percentages. The rows have different denominators, and some people receive more than one kind of care.
A chart worth keeping with its caveat
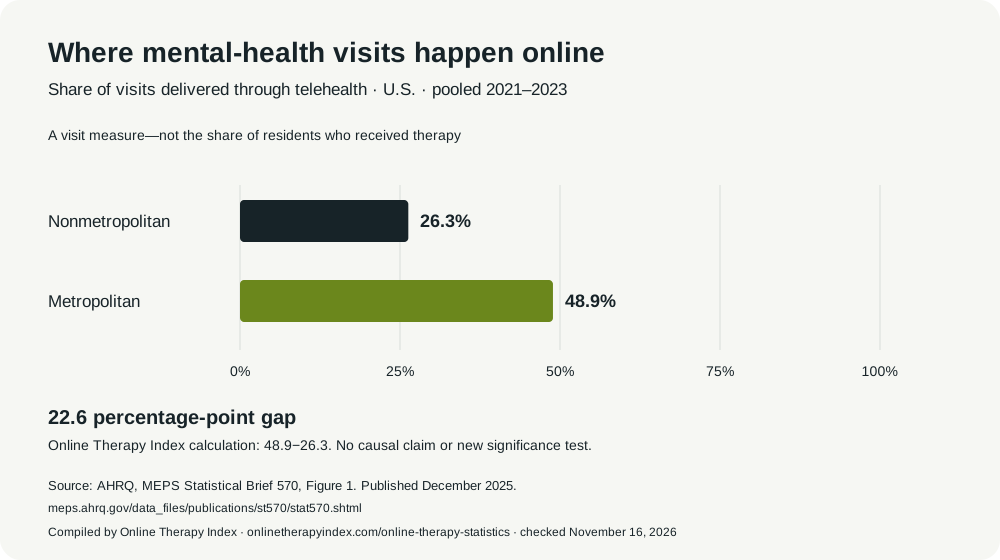
Our calculation: 48.9 − 26.3 = 22.6 percentage points. That is the difference between the two telehealth visit shares in AHRQ's pooled data. The chart uses a zero-to-100% scale and shows the original percentages.
This is not a comparison of the percentage of rural and urban residents who received therapy at all. It describes the delivery method of recorded visits to mental-health providers. AHRQ's provider category includes psychiatrists, psychologists, social workers, and mental-health counselors or marital/family therapists. AHRQ definitions and results
The result is a useful check on a common assumption: making care available online does not, by itself, establish equal use of remote care. The chart alone cannot tell us the cause of the difference.
Therapy use by age: broader context, not online-only use
The CDC's 2024 National Health Interview Survey measured counseling or therapy in any setting. These figures should not be labeled online therapy adoption.
| Adults who received counseling or therapy in the past 12 months | Estimate | 95% confidence interval |
|---|---|---|
| All adults | 14.0% | 13.5%–14.5% |
| Ages 18–29 | 20.2% | 18.7%–21.8% |
| Ages 75 and older | 5.0% | 4.3%–5.8% |
Source: CDC/NCHS Data Brief 564, Tables 1–2, published June 2026; data from 2024.
The confidence intervals show sampling uncertainty. A survey estimate is not a count of every person, and an age-group difference does not explain why people did or did not receive care.
What these statistics cannot tell you
How many Americans use a therapy app?
The SAMHSA telehealth measure is not a census of BetterHelp, Rula, Talkspace, or any other platform. It can include remote mental-health treatment delivered through other practices or services. Do not relabel 32.6 million as commercial app customers, paid subscribers, or people using video psychotherapy only.
What share of all therapy is online?
The AHRQ figures count visits to a defined group of mental-health providers. The CDC figures count people reporting therapy or counseling. Dividing one by the other would not produce a valid national share of therapy delivered online.
Does online therapy work for everyone?
Use statistics do not measure treatment effectiveness. These tables cannot establish that one platform works better than another, that online treatment fits a particular person, or that the growth of telehealth caused better health outcomes.
Is online care affordable?
None of these percentages tells you an individual's bill. Insurance network, benefit rules, provider fees, and appointment frequency matter. Use our therapy cost guide and calculator, or start with insurance coverage.
Method: how to cite and compare the numbers
Start with the right unit. A person can attend many appointments. A percentage of people is not a percentage of visits. An app's account count, enrolled members, paid users, and people eligible through an employer are also different measures.
Keep the denominator. “32.8% of adults with any mental illness” cannot become “32.8% of adults.” The whole adult population and a clinical subgroup are different bases.
Keep the setting. “Counseling or therapy” in the CDC survey includes delivery settings beyond telehealth. “Mental-health treatment through telehealth” is broader than the ordinary meaning of a video therapy appointment.
Keep the year. NSDUH 2025 describes a past-year period reported by people interviewed in 2025. The AHRQ figures pool three years. A source's publication date is not the time when all the care happened.
Do not create a trend by joining unmatched figures. SAMHSA changed some treatment questions and updated weighting and modeling in its 2025 release. Its methods say the telehealth questions themselves were unchanged from 2022–2025, while the broader inpatient/outpatient and any-treatment measures require additional care when comparing years. We show a cross-section rather than mix older published estimates into an apparent growth curve. SAMHSA methodology
Downloads, definitions, and reuse
The CSV contains nine records, including the derived gap. Each record gives the metric, value, unit, denominator, data period, publisher, publication period, source location, and check date. Confidence intervals are included for the selected CDC estimates. Blank fields mean a value is not supplied in this compilation; they do not mean zero.
The SVG chart can be enlarged without losing sharpness. Its source, data period, and denominator are printed on the graphic. Keep those details with the image when you reuse it.
Suggested citation: Online Therapy Index. Online therapy statistics: U.S. use, access, and sources. Sources checked November 16, 2026. https://onlinetherapyindex.com/online-therapy-statistics. For any individual number, also cite the government source named in its row.
You can reuse our chart and compilation with source attribution. Please identify the figures as government survey findings and the 22.6-point gap as our subtraction of the published estimates.
Found a transcription error or a newer original source? Send a correction with the affected statistic and source link.
Original sources
- SAMHSA, 2025 National Survey on Drug Use and Health: annual national report, Figures 84–85; published July 2026. Population: U.S. civilian noninstitutionalized adults age 18 or older, with subgroup denominators where stated.
- SAMHSA: 2025 methodological summary and definitions, including section 3.4.11.1 and weighting discussion.
- CDC/NCHS: Mental Health Treatment Among Adults: United States, 2024, Data Brief 564, Tables 1–2; published June 2026. Population: U.S. civilian noninstitutionalized adults, NHIS household survey.
- AHRQ: Use of Telehealth in Nonmetropolitan and Metropolitan Areas, United States 2021–2023, Statistical Brief 570, Figure 1; published December 2025. Unit: visits to defined mental-health providers, from the Medical Expenditure Panel Survey Household Component.